Datadog + Slack: Incidents Declared Before the Pager Stops
Connect Datadog to Slack so incident evidence and downtime approvals land in the same channel, run it as an AI agent that pauses for a human before it silences any monitor.
How do you connect Datadog to Slack?
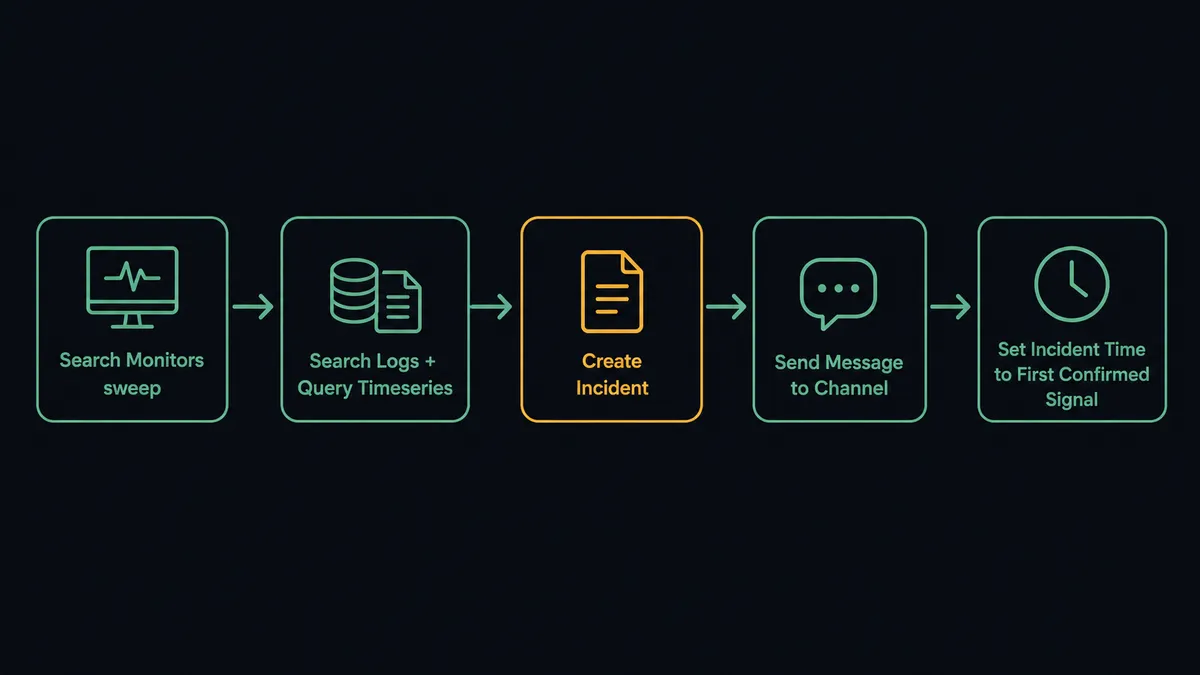
Connect Datadog to Slack by wiring a Search Monitors sweep to Search Logs and Query Timeseries for evidence, then to Create Incident and Send Message to Channel so the incident lands in your Slack channel with the correlated data already attached. FlowRunner is a visual AI-agent orchestration platform where automations run autonomously and pause for human judgment on the steps that carry real consequence. On FlowRunner, that same connection can run as an AI agent that reads the Datadog evidence, declares the incident on its own, and still stops to ask a person in Slack before it does anything irreversible, like muting a monitor.
The problem it solves
When a Datadog monitor fires, the responder’s first ten minutes go to archaeology, not fixing anything. They pull up the monitor, cross-reference the log index, check whether the metric graph is a real trend or a blip, and try to remember if anyone deployed in the last hour. By the time an incident actually gets declared in Datadog, the pager has been going off for a while and the timeline is missing its own first minutes. None of that work requires judgment. It requires someone to correlate three data sources fast, and it happens the same way every time a monitor alerts.
The other half of the problem is silence. Monitors get muted by hand before maintenance windows, using scope patterns that are easy to write too broadly. Nobody circulates a list of what stops watching production before the mute goes live, and nobody is accountable for un-muting it on time. A scope meant to cover one service can quietly cover four, and the team finds out the coverage gap existed only when something breaks during the window and pages nobody.
How it works: the connection
A scheduled sweep runs Search Monitors and finds every monitor currently in alert state. For each hit, the workflow calls Search Logs to pull the log lines correlated with that monitor, and Query Timeseries to confirm the spike is sustained rather than a single noisy data point. Once the signal is confirmed, Create Incident declares it in Datadog Incident Management with severity and impact filled in from what was just gathered.
The final step is Send Message to Channel in Slack, which posts the incident title, severity, and the evidence links, log excerpts, and metric graph, into the on-call channel. The responder who opens that thread is not starting from a raw alert. They are starting from a case file that already has the correlated logs, the confirmed trend, and, if a deploy happened recently, the deploy marker that explains it.
Can an AI agent run it? (and why a human stays in the loop)
Yes, and the version worth building is the one where the agent does more than sync data. The agent reads what Search Monitors, Search Logs, and Query Timeseries return, reasons about whether the pattern is real, and chooses to call Create Incident and Send Message to Channel as tools, in that order, because the situation calls for it. That is different from a fixed pipeline that always runs the same three steps regardless of what the data shows.
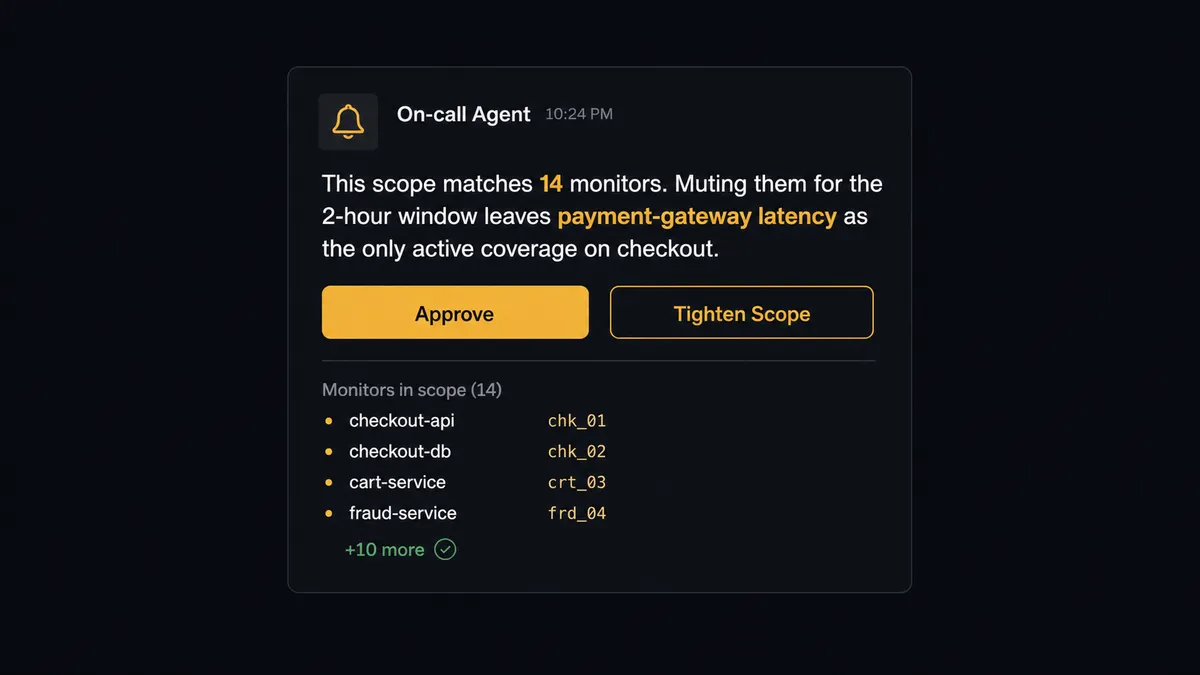
The moment that separates this from a plain sync tool is what happens when the fix touches Create Downtime or Mute Monitor. Muting a monitor makes observability deliberately worse for a window, and a scope pattern that matches more than intended means a real incident during that window pages nobody. So the agent never treats silencing as something it decides alone. Say a planned database migration needs a maintenance window: the agent resolves which monitors the scope env:prod service:checkout actually matches, finds 14 of them, and instead of muting them, it posts to the on-call lead in Slack: “This scope matches 14 monitors, listed below. Muting them for the 2-hour window leaves payment-gateway latency as the only active coverage on checkout. Approve, or tighten the scope?” That message uses Slack’s On Block Action trigger with Approve and Tighten buttons.
The lead approves, tightens, or rejects from their phone. Only after a response does Create Downtime run, time-boxed to the maintenance plan, and Cancel Downtime restores coverage automatically if the work finishes early. The decision, the decider, and the timestamp are captured in the audit trail. This is not a sync tool quietly muting monitors on a schedule. The agent knows when to stop and ask.
FlowRunner vs n8n
n8n is a strong choice for technical teams that want full control over workflow logic and are comfortable maintaining self-hosted infrastructure; its Datadog and Slack nodes cover the same basic API surface and its community has built a large library of templates. Where the two platforms diverge is what happens at the moment a workflow needs a human decision, and what it costs to get compliance-grade tracking of that decision.
| What matters here | FlowRunner | n8n |
|---|---|---|
| Human-in-loop on the mute/downtime step | Native: the agent invokes a human-in-loop flow as a callable tool and waits for the Slack decision before Create Downtime runs | Not native: requires custom-built wait/webhook logic strung together by hand |
| Users on the plan | Unlimited users on every tier | Per-seat limits on lower tiers |
| AI provider keys | BYOK: connect your own OpenAI or Anthropic key, pay the provider directly | Also BYOK for its AI nodes |
| Self-hosted option | Free Community Edition, plus a self-hosted Enterprise tier with clustering | Self-hosted is the default model, with a paid Business tier for SSO |
| Pricing model | Transparent workflow-based tiers with a fixed execution ceiling per tier | Execution-based pricing that can be hard to predict at scale |
Before and after
| Category | Before | After |
|---|---|---|
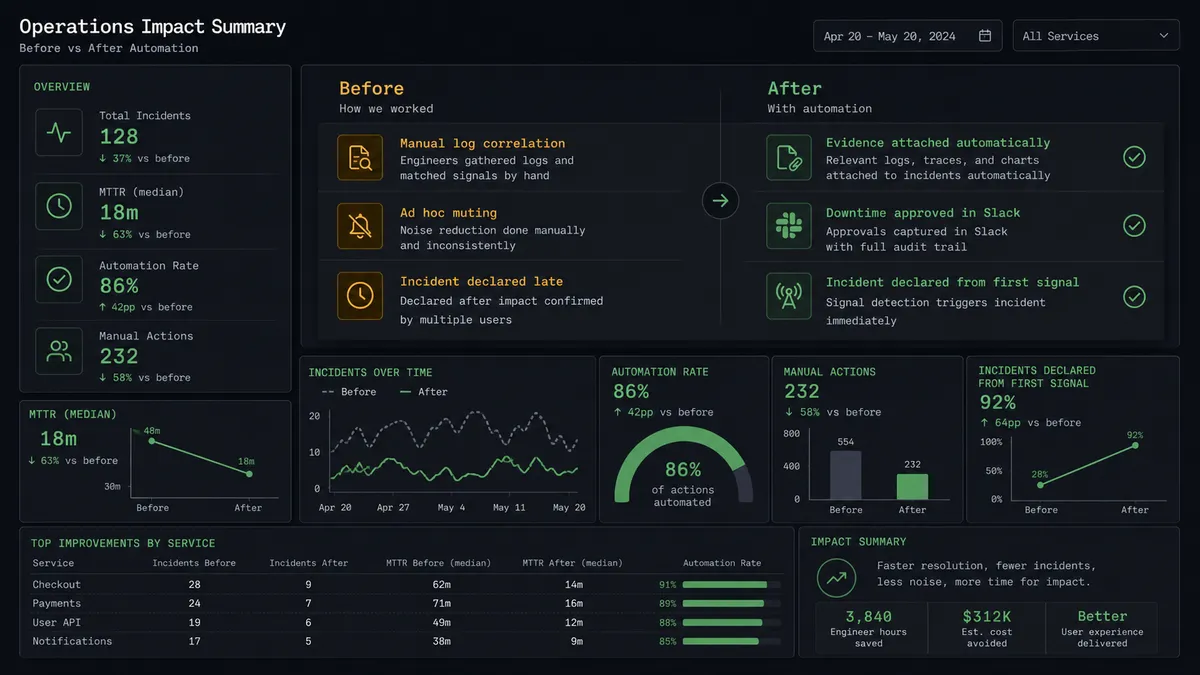
| Alert triage | The responder pieces together logs, metrics, and recent deploys by hand while the pager keeps firing | The incident already contains the correlated logs, the metric trend, and the deploy marker |
| Maintenance windows | Monitors get muted ad hoc, and nobody is sure what is still watching production | Every downtime is scoped, approved, and time-boxed in Slack before any monitor goes quiet |
| Incident timing | The formal incident starts after the scramble, so the timeline never captures the first minutes | The incident exists from the first confirmed signal, with the triage attached to it |
| Approval trail | Managers ask team members directly to find out what is silenced or escalated | Every approval is captured with approver identity and timestamp automatically |
| Coverage after maintenance | Downtimes get forgotten and monitors stay muted longer than the plan called for | Cancel Downtime restores coverage automatically the moment work finishes early |
What you can build
Incident evidence in Slack before the responder opens their laptop. Search Monitors, Search Logs, and Query Timeseries feed Create Incident, and Send Message to Channel puts the assembled case file in the on-call channel the moment the incident exists.
A deploy gate that pauses on failing user journeys. Post Event drops a deploy marker, Trigger Synthetics CI Tests runs the critical journeys, and if Get Synthetics Test Results comes back failing, Send Direct Message alerts the release owner with the diff and the failing journeys before the rollout continues.
Maintenance windows nobody has to guess about. The agent proposes a downtime scope, posts it to Slack for approval through On Block Action, and only then runs Create Downtime, with Cancel Downtime firing automatically when work wraps early.
A Monday status digest for leadership. The agent compiles the week’s monitor sweeps, incidents declared, and downtimes approved, and posts it to an #operations channel using Block Kit, so leadership sees the pattern without pulling a report by hand.
Common questions
Is it free to connect Datadog and Slack on FlowRunner? Yes to start. FlowRunner has a free plan with 100 executions a month, every integration included, and no credit card required, and new accounts get 14 days of Professional on top.
Can I self-host this connection? Yes. FlowRunner offers a free self-hosted Community Edition for a single instance, and a self-hosted Enterprise option with clustering and full audit retention.
Does the agent need my own OpenAI key? Yes. FlowRunner runs on a bring-your-own-key model; you connect your own provider key and pay that provider directly.
What happens when the agent isn’t sure whether to mute a monitor? It posts the proposed scope and what would stop being watched to Slack and waits for a decision before Create Downtime ever runs.
Does this replace PagerDuty or my existing on-call paging? No. The agent still pages on-call through your existing system; the Slack thread it opens already has the correlated evidence attached.
Getting started
FlowRunner has a free plan with 100 executions a month, every integration included, and no credit card required, and new accounts get 14 days of Professional on top. Connect Datadog and Slack, build the sweep-to-incident flow above, and add the Slack approval step before you wire up anything that mutes coverage.
Start building at flowrunner.ai, or book a walkthrough at calendly.com/flowrunner/intro.
Frequently asked questions
Is it free to connect Datadog and Slack on FlowRunner?
Yes to start. FlowRunner has a free plan with 100 executions a month, every integration included, and no credit card required, and new accounts get 14 days of Professional on top.
Can I self-host this connection?
Yes. FlowRunner offers a free self-hosted Community Edition for a single instance, and a self-hosted Enterprise option with multi-instance clustering and full audit retention for teams that need Datadog and Slack traffic to stay inside their own infrastructure.
Does the agent need my own OpenAI key?
Yes. FlowRunner runs on a bring-your-own-key model, so you connect your own OpenAI, Anthropic, or other provider key and pay that provider directly. FlowRunner does not mark up model usage.
What happens when the agent isn't sure whether to mute a monitor?
It does not guess and it does not mute anything on its own. It posts the proposed scope and what would stop being watched to a Slack channel or a specific on-call lead, and waits for an Approve, Tighten, or Reject decision before Create Downtime ever runs.
Does this replace PagerDuty or my existing on-call paging?
No. FlowRunner sits alongside your paging tool. The agent still pages on-call through your existing system; what changes is that the Slack thread the responder opens already contains the correlated logs, the metric trend, and the deploy marker instead of a raw alert.