Datadog + PagerDuty: Every Alert Pages With Evidence Attached
Connect Datadog and PagerDuty so confirmed alerts page on-call with correlated logs and metrics attached, and an AI agent can run the flow while a human acknowledges before any recovery step.
How do you connect Datadog to PagerDuty?
Connect Datadog to PagerDuty by wiring a monitor sweep or incident trigger on the Datadog side to Trigger Alert and Create Incident on the PagerDuty side, so a confirmed signal in Datadog becomes a paged incident in PagerDuty automatically. FlowRunner is a visual AI-agent orchestration platform where automations run autonomously and pause for human judgment on the steps that carry real consequence. The same connection can run as an AI agent that reads the monitor data, correlates it with logs and recent deploys, and pages on-call with the evidence already attached, then stops and waits for a human to acknowledge before anything runs against production. That last part is the upgrade a plain sync tool cannot offer.
The problem it solves
When a monitor fires at 3am, the on-call engineer inherits a scavenger hunt before they inherit a problem. They open Datadog to see what’s alerting, open a second tab to search logs for the error lines, open a third to check whether a deploy went out in the last hour, and all the while the pager keeps buzzing with the same signal restated five different ways. By the time an incident actually gets declared in PagerDuty, the first ten minutes of the timeline are gone, and nobody wrote down what was actually happening when it started.
The same gap shows up on the quiet side. Someone mutes a set of monitors before a migration, scoped by a tag pattern that felt right at 2pm on a Tuesday. Nobody double-checks what else that pattern touches. If it’s broader than intended, a real incident during the maintenance window pages nobody, and the team finds out from a customer instead of a monitor. Ops leads want the mechanical correlation work automated. They do not want the decision of what stays quiet, or what counts as an incident, handed to a script that can’t tell the difference between routine noise and a real outage.
How it works: the connection
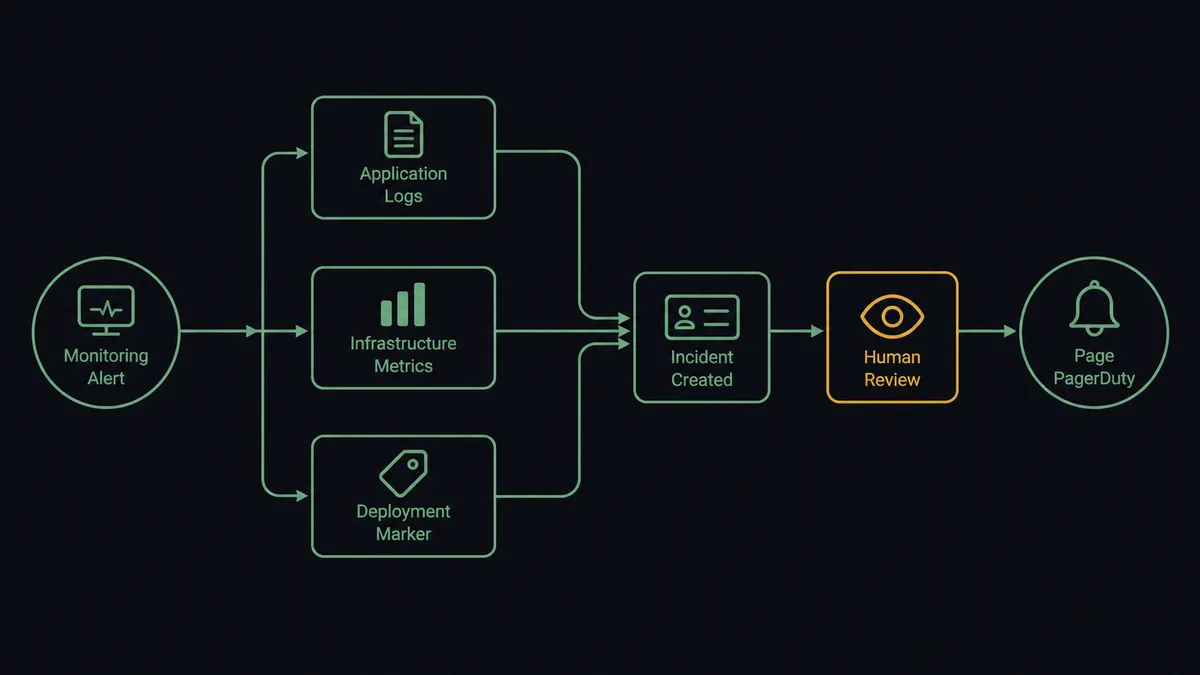
The flow starts with a scheduled sweep that runs Search Monitors on the Datadog side, pulling every monitor currently in alert state. For each hit, the agent calls Get Monitor to understand what the alert actually watches, then runs Search Logs to pull the correlated error lines and Query Timeseries to confirm the anomaly is sustained rather than a single noisy data point. That validation step is the difference between reacting to a blip and reacting to a real problem.
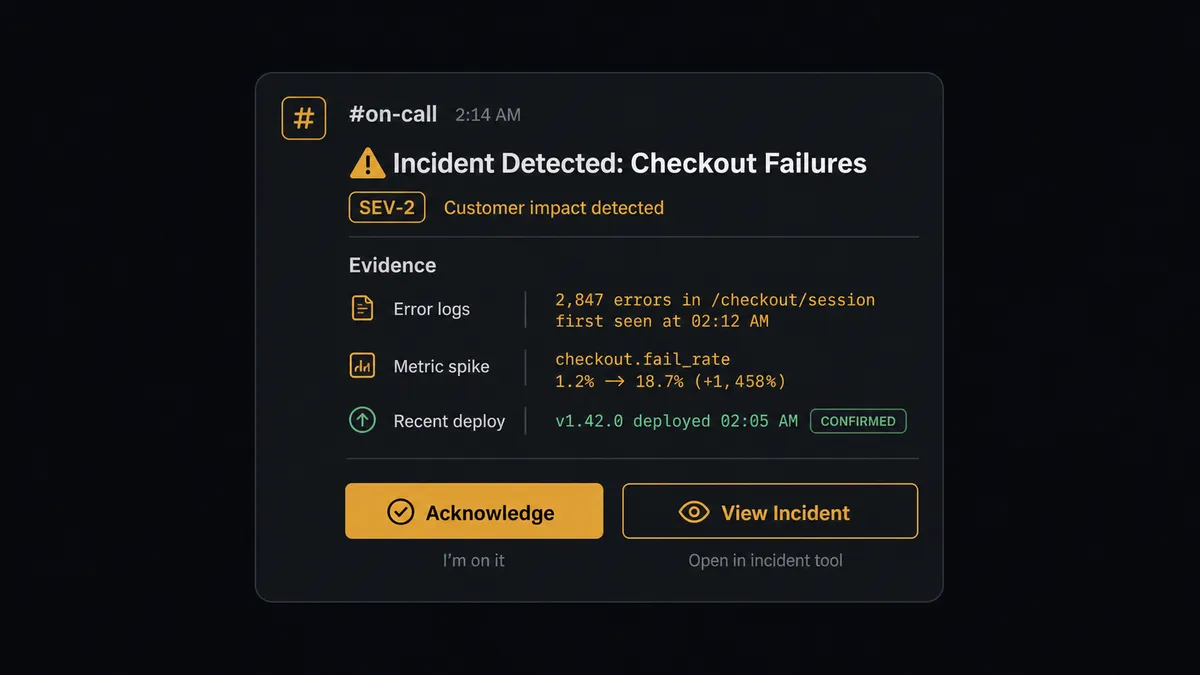
Once a signal is confirmed, Create Incident declares it in Datadog with the evidence already attached: the log lines, the metric trend, and any recent deploy marker pulled from Post Event history. On the PagerDuty side, the agent calls Trigger Alert into the Events API v2 using a deduplication key, so a recurring signal updates the same alert instead of spawning duplicates, and Create Incident opens the formal incident on the correct service. List On-Calls tells the agent who is actually on call right now, and that name goes into the summary posted to the incident channel, alongside the urgency and the likely cause.
If a deploy went out recently, Send Change Event on the PagerDuty side records it against the incident, so the responder sees the correlation between the change and the alert without having to go dig for it themselves. The incident that lands in front of the on-call engineer already contains what would otherwise take ten minutes of tab-switching to assemble.
Can an AI agent run it? (and why a human stays in the loop)
Yes, and this is where FlowRunner’s orchestration differs from a workflow tool that just moves data between two apps. The agent doesn’t run a fixed script of “if monitor alerts, then page.” It reads the monitor definition, evaluates the log correlation and the timeseries trend, and decides for itself whether the signal is strong enough to declare an incident. A single noisy data point that recovers on its own gets logged, not paged. A sustained spike correlated with a deploy marker from the last hour gets escalated with that correlation already stated in the summary.
The consequential step is what happens after the page goes out. PagerDuty’s own incident lifecycle already has an acknowledgement gate built in, and the agent respects it as a hard stop, not a suggestion. When there’s a recovery action on the table, such as rolling back a config or restarting a service, the agent posts the proposed action and the supporting evidence to the on-call channel and then holds. It watches for the on-call engineer to acknowledge the incident in PagerDuty, using List Log Entries to confirm the acknowledgement is real and to capture who did it. Only after that acknowledgement does the agent run the recovery step, and the acknowledgement itself becomes part of the incident timeline.
This is not a sync tool. The agent knows when to stop and ask. On the Datadog side, the same discipline applies to silence: Mute Monitor and Create Downtime are treated as proposals, not actions the agent takes on its own. Before scheduling a maintenance window, the agent resolves exactly which monitors a scope pattern would match, lists them by name, and tells the on-call lead what stays watching and what goes quiet: “The scope env:prod service:checkout matches 14 monitors. Muting them for the 2-hour window leaves payment-gateway latency as the only active coverage on checkout. Approve, or tighten the scope?” Nothing goes quiet until a person reads that list and says yes. This is the digital andon cord: the agent gathers evidence and proposes action continuously, but it pulls the cord and waits the moment a decision carries real consequence.
FlowRunner vs Zapier
Zapier is genuinely good at what most teams first reach for: a fast, no-code way to fire a PagerDuty alert off a webhook or a simple trigger, and its Datadog and PagerDuty apps are both mature and well documented. For a single-step “if this monitor fires, page this service” rule, Zapier gets it done with very little setup.
Where it runs out of road is everything this page just described: correlating logs and metrics before deciding whether a signal is real, naming the on-call responder dynamically, and holding a recovery action until a human acknowledges. Zapier’s model is trigger-to-action; it doesn’t reason about the data in between, and it has no native concept of pausing a multi-step flow for a person’s judgment mid-run.
| Capability | Zapier | FlowRunner |
|---|---|---|
| Human-in-the-loop as a workflow step | Not native; requires a separate approval app bolted on | Built in; the agent invokes a human-in-loop flow as a callable tool |
| Reasoning across steps (correlate logs, metrics, deploys) | Fixed trigger-to-action chains only | Agent reads context and decides what to escalate |
| Pricing model | Per-task pricing that scales with every step in a multi-step Zap | Transparent workflow-based execution tiers |
| Users included | Paid per user on most plans | Unlimited users on every tier |
| Self-hosting | Not offered | Community Edition (free) and self-hosted Enterprise |
| BYOK for AI providers | Not applicable (no native AI agent layer) | Bring-your-own-key across AI providers |
Before and after
| Metric | Before | After |
|---|---|---|
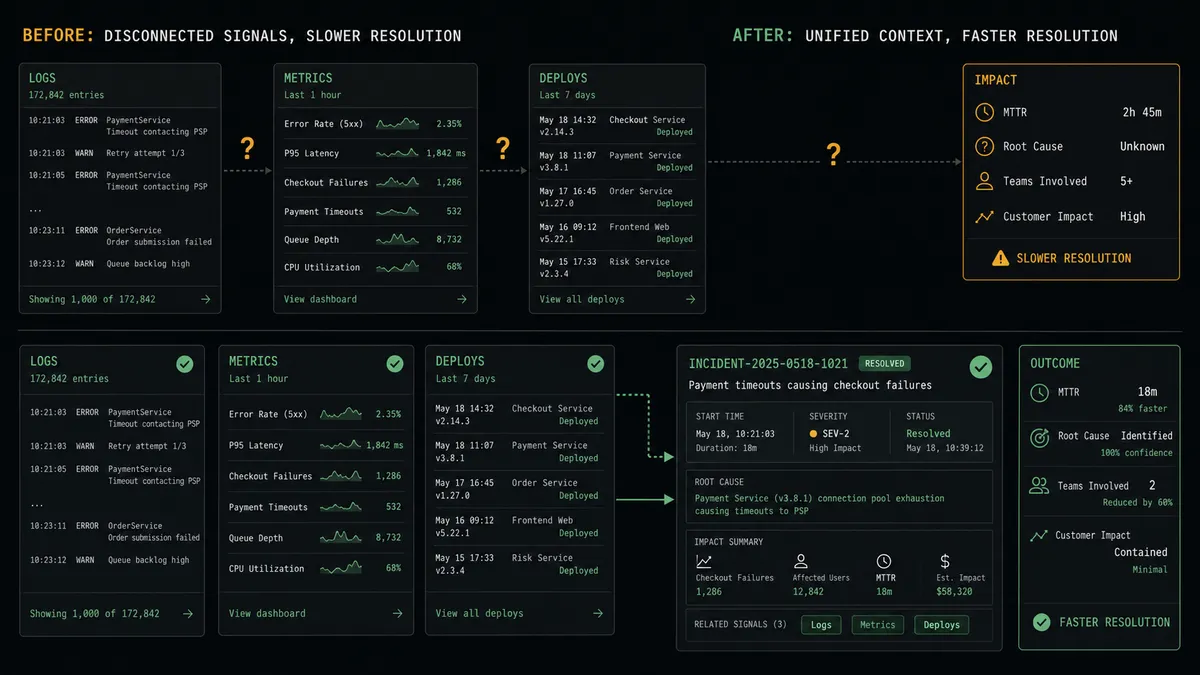
| Triage start | The responder pieces together logs, metrics, and deploys by hand while the pager keeps firing | The incident opens with correlated logs, the metric trend, and the deploy marker already attached |
| Time to declared incident | The formal incident starts after the scramble, so the first minutes are never captured | The incident exists from the first confirmed signal, with triage attached |
| Maintenance silencing | Monitors get muted ad hoc, and nobody is sure what’s still watching production | Every downtime is scoped, approved, and time-boxed before anything goes quiet |
| Incident context on page | On-call status, recent changes, and runbook links are collected by hand after the page | The agent posts urgency, likely cause, and the responder’s name with the page itself |
| Recovery actions | Whoever’s paged decides on the spot whether to run a fix, with no formal gate | Recovery waits for the on-call engineer to acknowledge in PagerDuty, and that decision is on the record |
What you can build
Evidence-assembled paging. A scheduled sweep runs Search Monitors, confirms alerts with Search Logs and Query Timeseries, then declares the incident in Datadog and pages the correct PagerDuty service with the evidence attached, so the responder never opens a bare alert again.
Deploy-aware incident correlation. Every release posts a deploy marker with Post Event on the Datadog side and a matching Send Change Event on the PagerDuty side, so any incident that follows automatically shows the change most likely to have caused it.
Gated maintenance windows. Before a planned migration, the agent resolves the exact monitor scope, lists what goes quiet, and only calls Create Downtime and Create Maintenance Window on both sides after the on-call lead approves the list.
Acknowledgement-gated recovery. When an incident triggers on a service with an automated fix available, the agent posts the proposed recovery to the on-call channel and waits for List Log Entries to confirm the on-call engineer acknowledged in PagerDuty before running anything.
Incident storm consolidation. When a single root cause fires multiple monitors at once, the agent uses Merge Incidents in PagerDuty to collapse the related pages into one incident, so the responder handles one clear signal instead of five duplicate ones.

Common questions
Is it free to connect Datadog and PagerDuty on FlowRunner? Yes. FlowRunner has a free plan with 100 executions a month, every integration included, and no credit card required, and new accounts get 14 days of Professional on top.
Can I self-host the Datadog to PagerDuty connection? Yes. FlowRunner offers a self-hosted Community Edition for single-instance deployments and a self-hosted Enterprise tier with multi-instance clustering for teams that need the workflow to run inside their own infrastructure.
Does the agent need my own OpenAI key? FlowRunner uses a bring-your-own-key model for AI providers, so you connect the AI account you already use rather than paying FlowRunner a markup on model usage.
What happens when the agent isn’t sure whether to page? It doesn’t guess. If Query Timeseries shows a spike that hasn’t sustained, or the log correlation is ambiguous, the agent holds the incident in a draft state and posts the raw evidence to the on-call channel instead of declaring an incident on uncertain signal.
Does this replace our escalation policies in PagerDuty? No. FlowRunner triggers alerts and incidents through PagerDuty’s own Events API and incident endpoints, so your existing escalation policies, schedules, and notification rules keep running exactly as configured.
Can the agent run recovery scripts automatically? Only after a human acknowledges. The agent can propose a recovery action and package the context for it, but it waits for the on-call engineer to acknowledge the incident in PagerDuty before it runs anything against production.
Getting started
FlowRunner has a free plan with 100 executions a month, every integration included, and no credit card required, and new accounts get 14 days of Professional on top. Build the sweep, wire the acknowledgement gate, and watch the first few incidents arrive with the evidence already attached. Start at flowrunner.ai or book time to walk through your specific on-call setup at calendly.com/flowrunner/intro.
Frequently asked questions
Is it free to connect Datadog and PagerDuty on FlowRunner?
Yes. FlowRunner has a free plan with 100 executions a month, every integration included, and no credit card required, and new accounts get 14 days of Professional on top.
Can I self-host the Datadog to PagerDuty connection?
Yes. FlowRunner offers a self-hosted Community Edition for single-instance deployments and a self-hosted Enterprise tier with multi-instance clustering for teams that need the workflow to run inside their own infrastructure.
Does the agent need my own OpenAI key?
FlowRunner uses a bring-your-own-key model for AI providers, so you connect the AI account you already use rather than paying FlowRunner a markup on model usage.
What happens when the agent isn't sure whether to page?
It doesn't guess. If Query Timeseries shows a spike that hasn't sustained, or the log correlation is ambiguous, the agent holds the incident in a draft state and posts the raw evidence to the on-call channel instead of declaring an incident on uncertain signal.
Does this replace our escalation policies in PagerDuty?
No. FlowRunner triggers alerts and incidents through PagerDuty's own Events API and incident endpoints, so your existing escalation policies, schedules, and notification rules keep running exactly as configured.
Can the agent run recovery scripts automatically?
Only after a human acknowledges. The agent can propose a recovery action and package the context for it, but it waits for the on-call engineer to acknowledge the incident in PagerDuty before it runs anything against production.